Online Tools
The ANF provides many web–based QC monitoring tools, split into 4 broad areas: realtime data; metadata and bulletins; network status; and state-of-health. Many of these tools display realtime graphical respresentations that can be interpreted to show the status of the network.
Realtime Data
Trace Displays
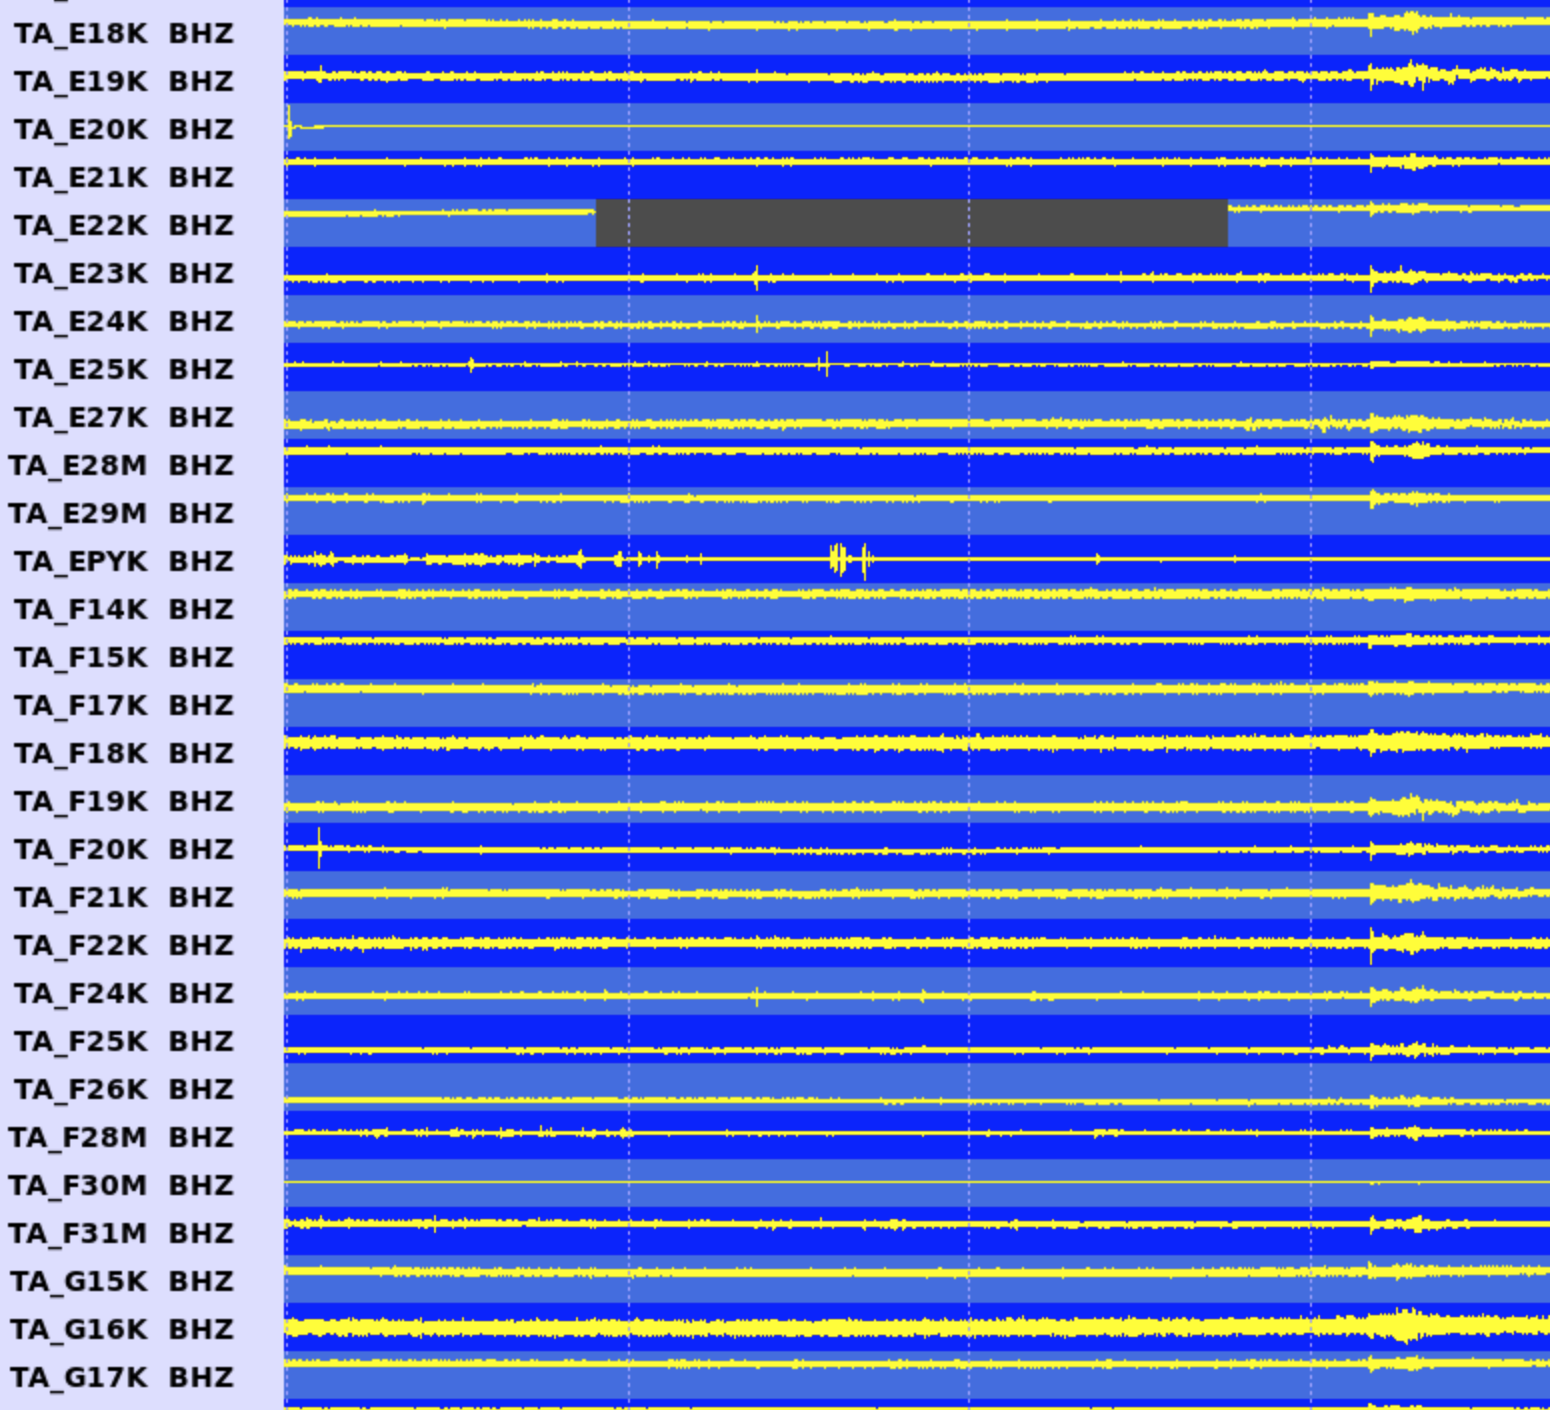 Orbrtd for TA network
Transportable Array realtime trace data
- Vertical-Broadband channels: 2 hr | 24 hr
- Pressure Sensor (LDM_EP): 24 hr
- Vertical-Broadband channels: 2 hr | 24 hr
- Pressure Sensor (LDM_EP): 24 hr
- Vertical-Broadband channels: 2 hr | 24 hr
ALASKA/CANADA:
LOWER48:
CONTRUBUTING NETWORKS:
Event Map - Seismicity
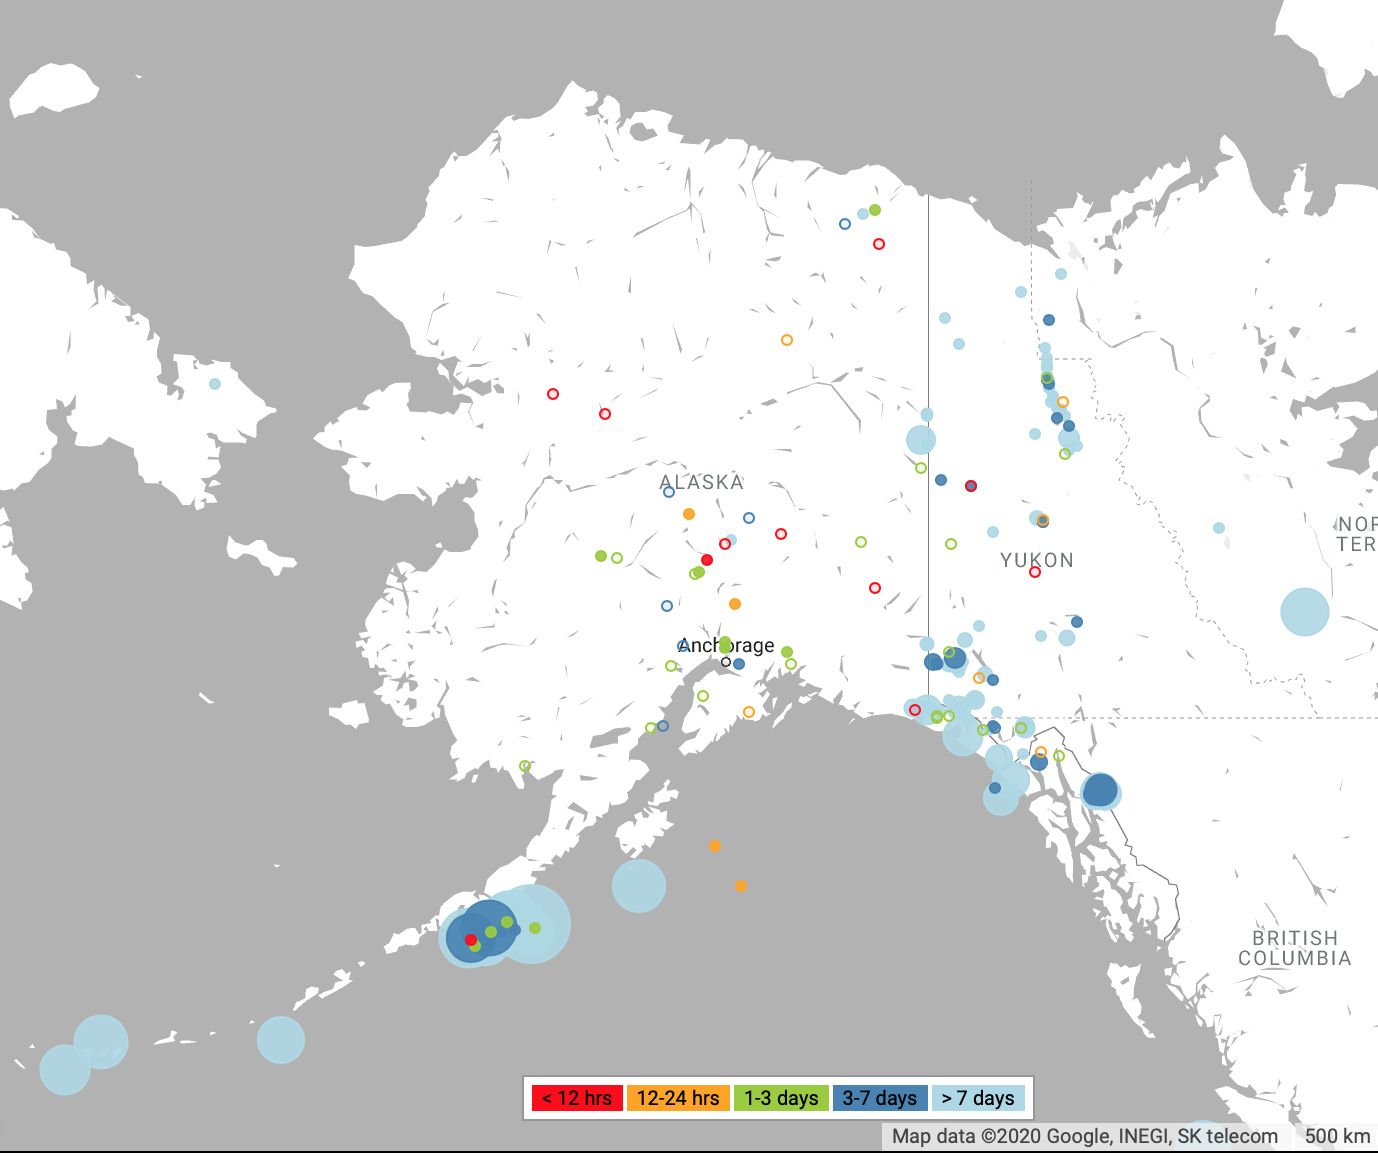 Recent seismicity map
Automatic event detection locations. Unlikely any analyst review
Network Status
Webdlmon - Datalogger SOH
![]() Webdlmon active dataloggers | prelim
Webdlmon active dataloggers | prelim
Sort columns, subset parameters, & integration with daily-weekly-monthly SOH plots.
Deployment Map - Station Status
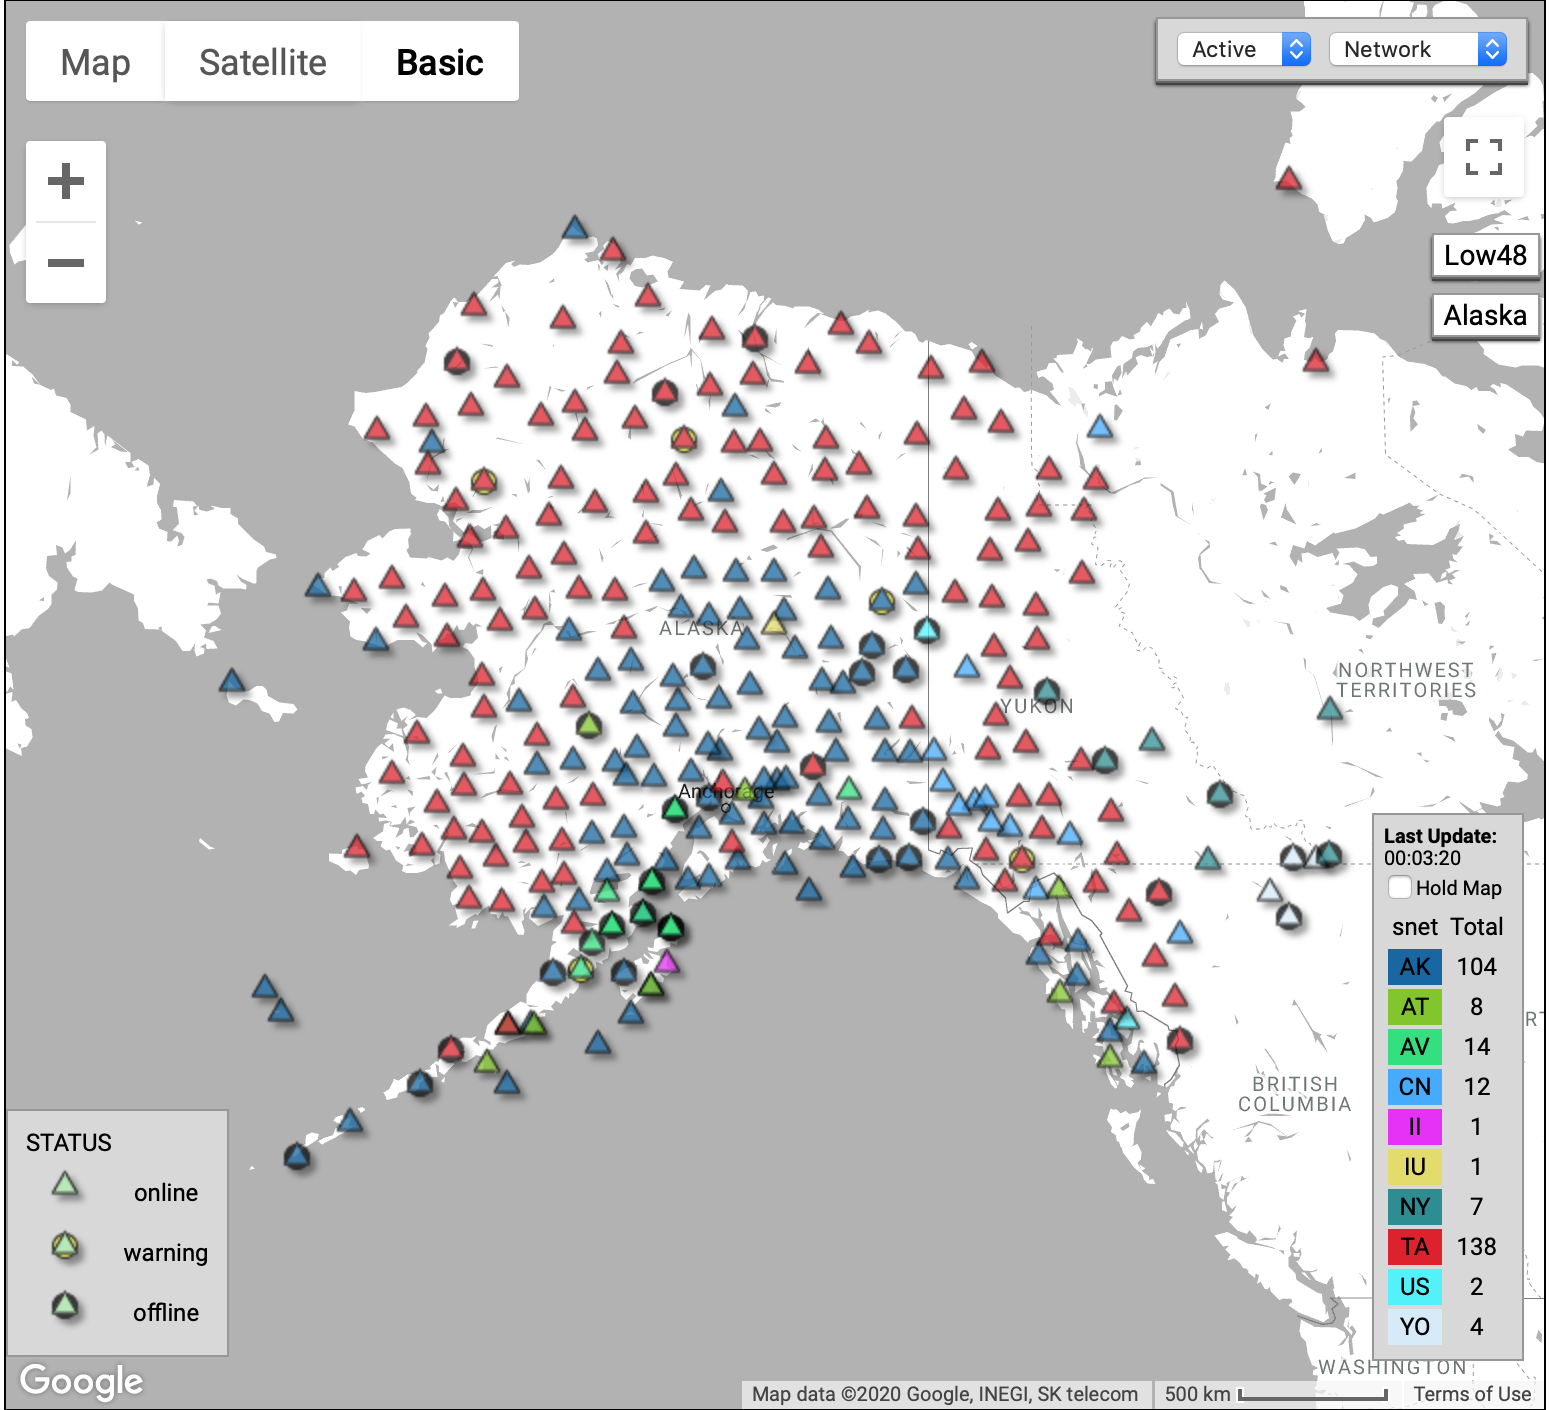 Active deployment map
View by network, comm type or provider, or sensor type
Daily Return Rates
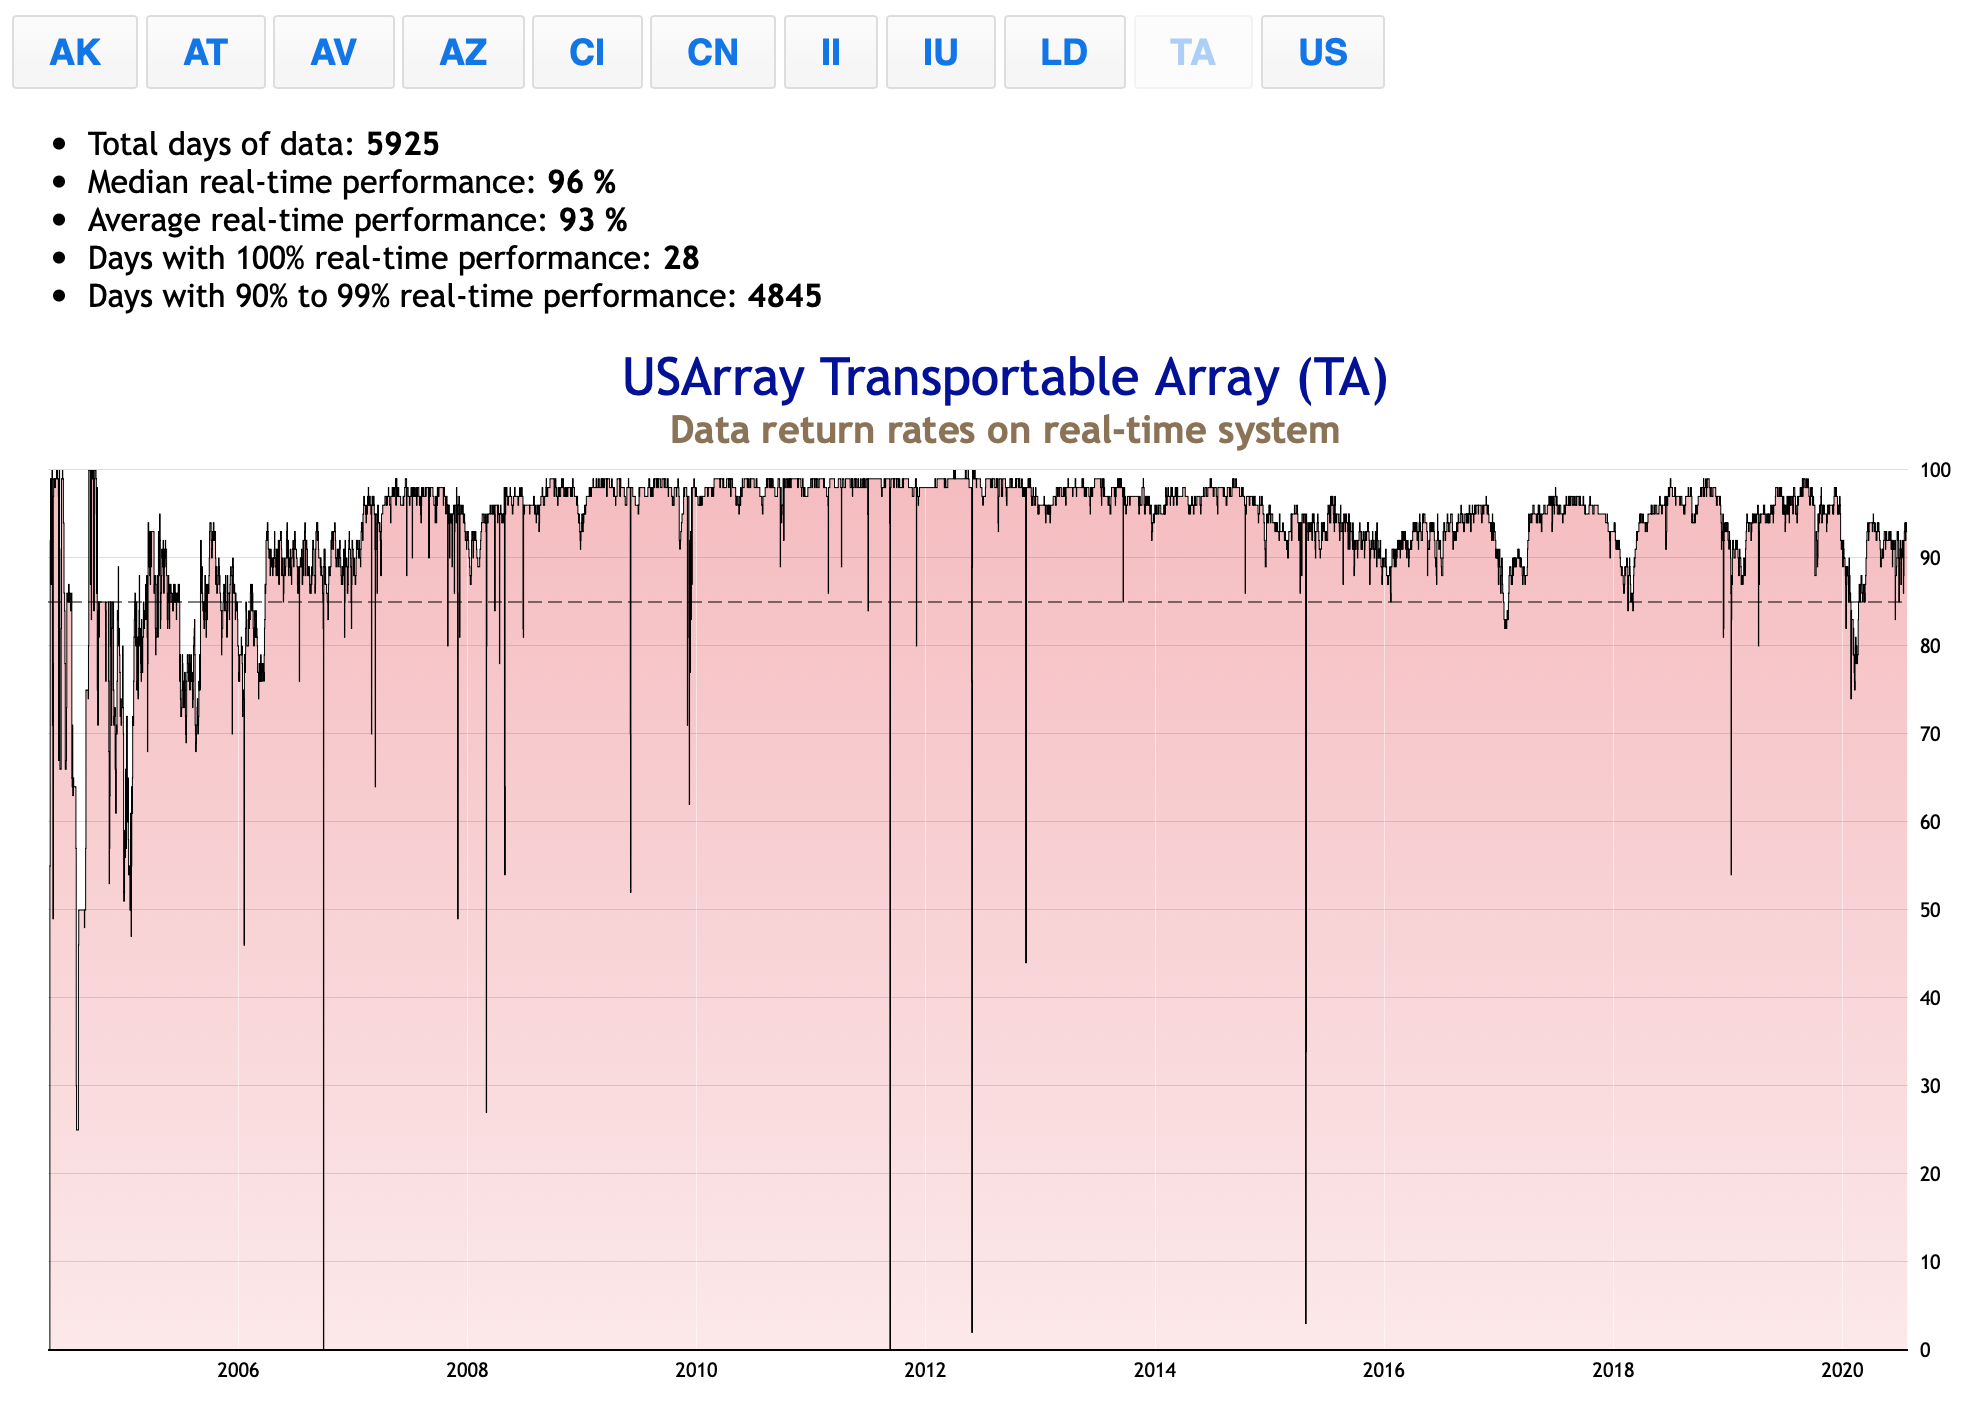 Data Return Rates
Interactive plots displaying daily data return rates to the ANF data center
Metadata and Bulletins
Metadata
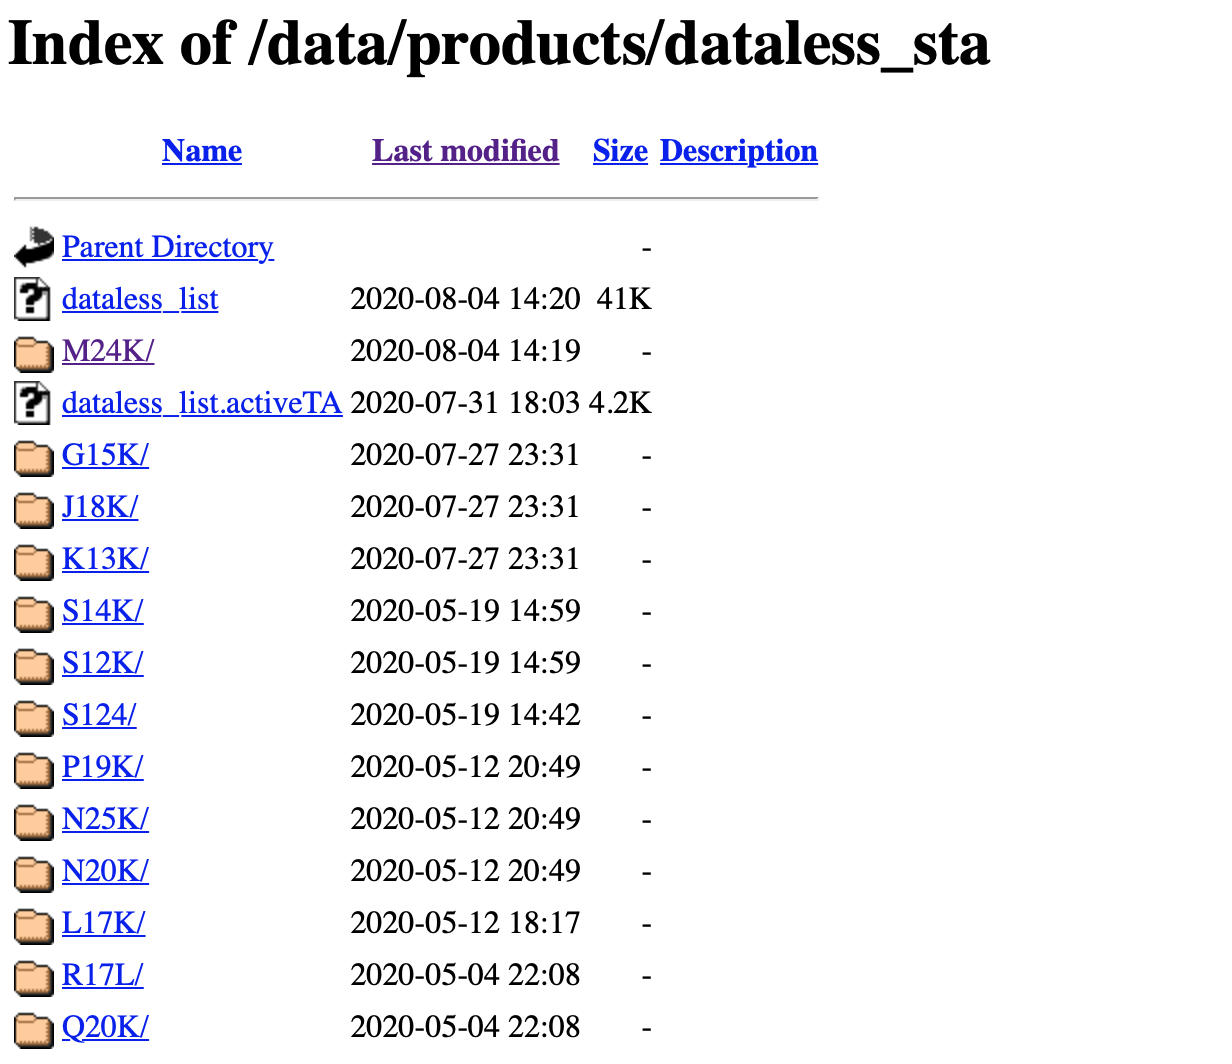 Download dataless SEED volumes for TA stations
TA metadata (site location, equipment installed, instrument response)
Analyst reviewed events
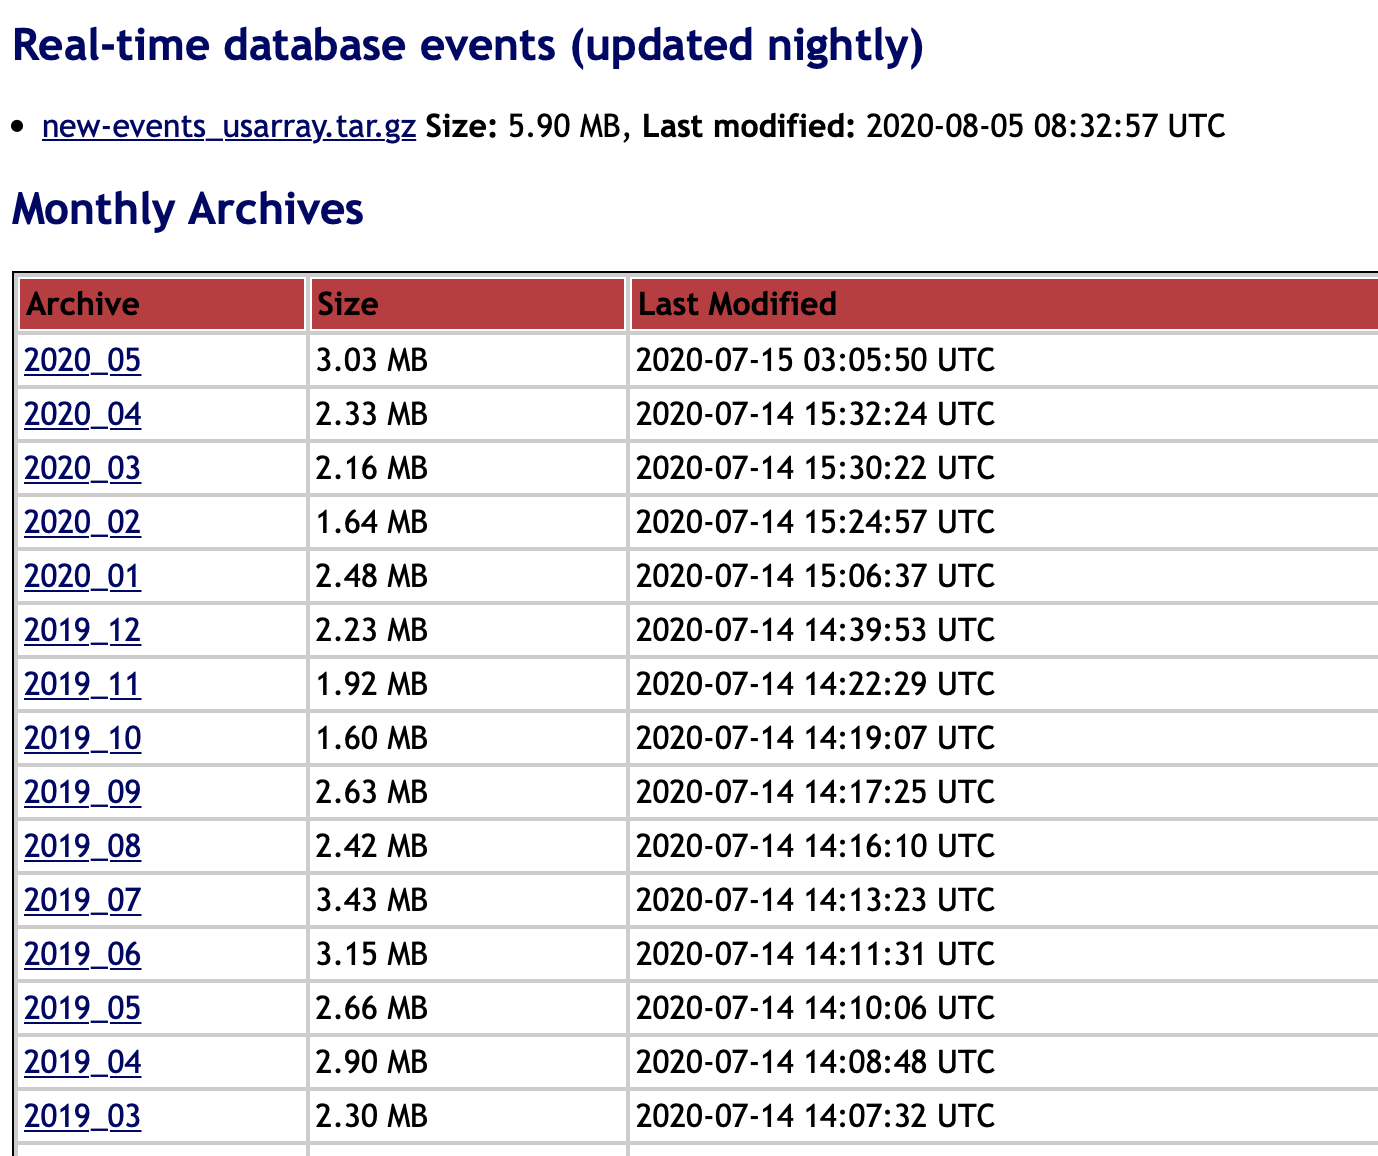 Download Events
Analyst reviewed monthly CSS3.0-format tables. Includes arrivals, origins, magnitudes, etc.
State of Health (SOH) Trends
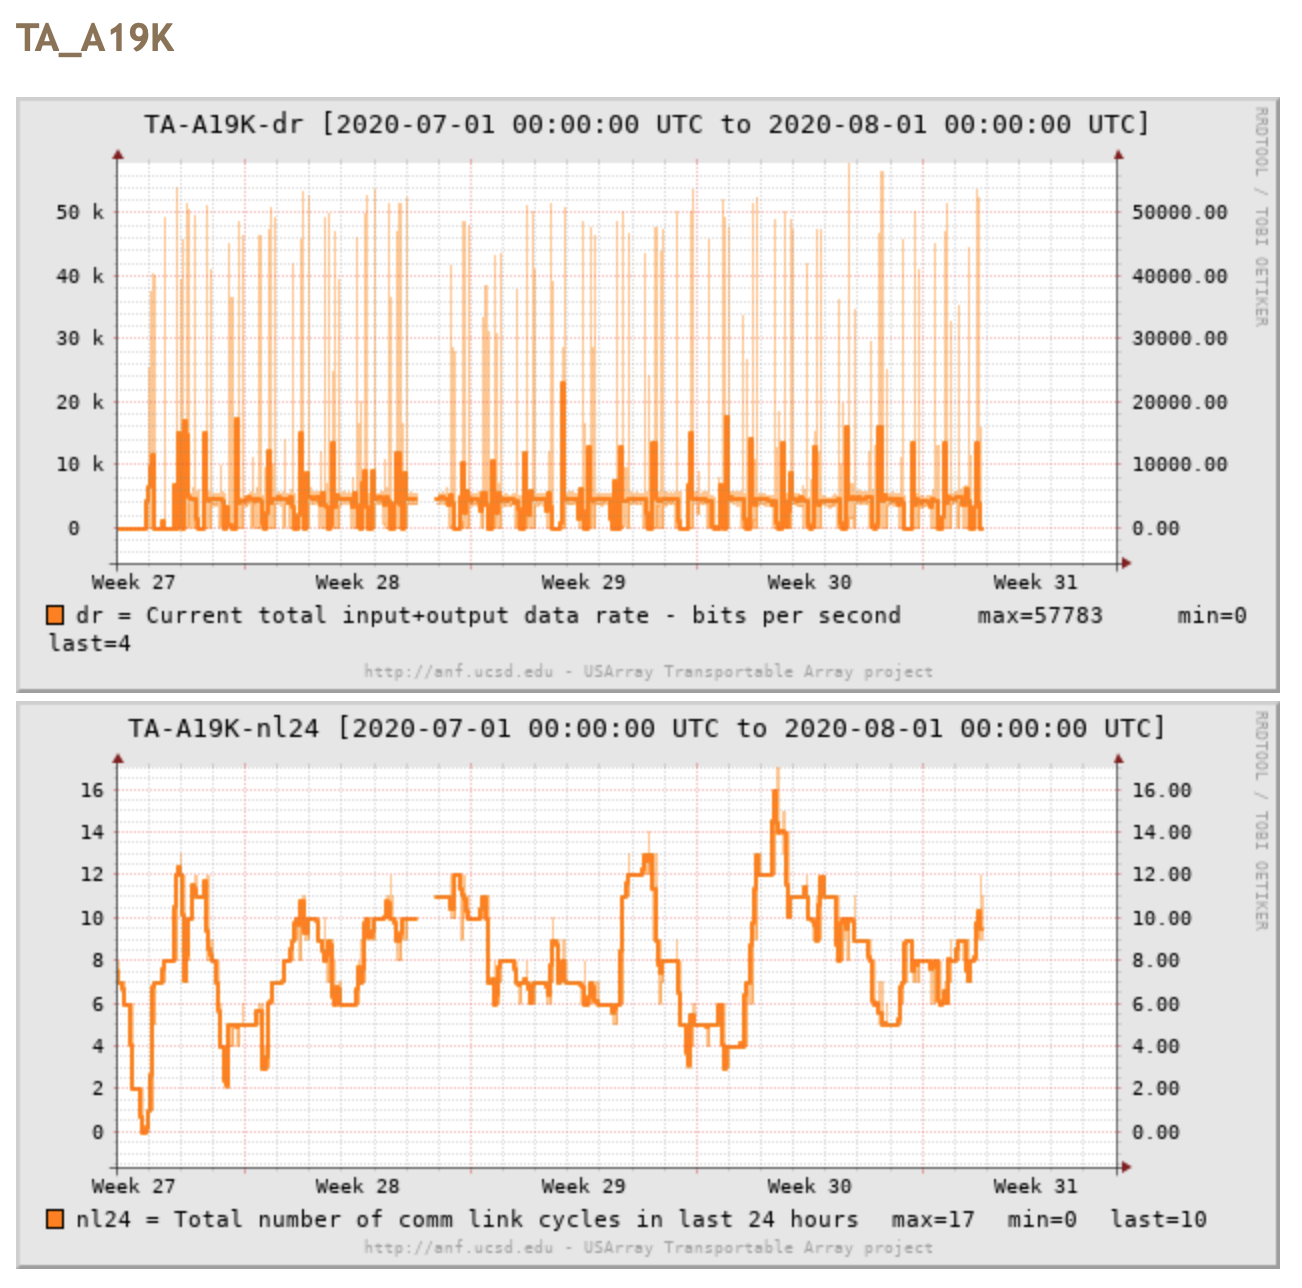 BGAN SOH explorer
Data Rate and CommLink Cycles for BGAN sites
 AOC Testbed
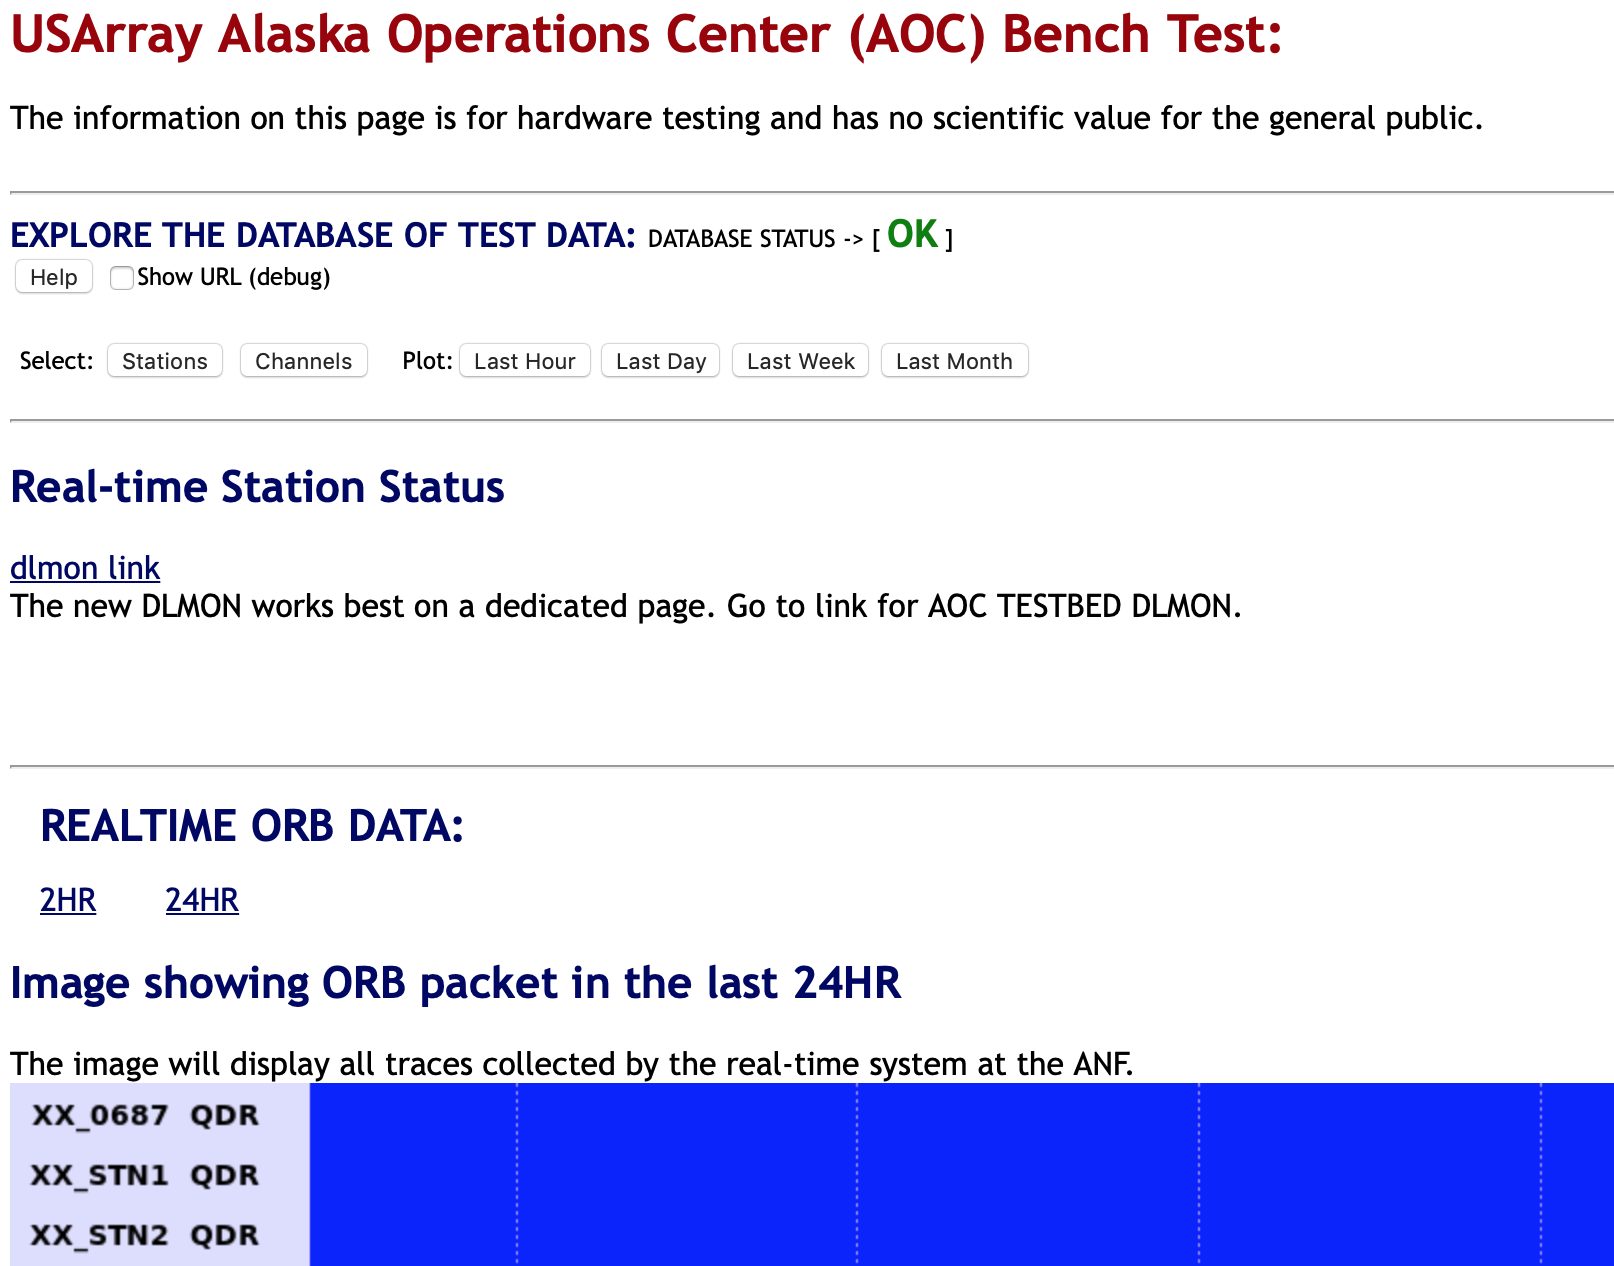
Data from bench test equipment (for our field team)
 SOH Archive Explorer
Customizable week-month-lifetime plots for user-chosen stations and SOH channels